open for investment
- Total financial Projection:
- $92,000,000
- Minimum Investment : $5,000
- Funding :
79% Funded
- location_city USE: MULTIFAMILY
- location_on Mission Matthews Place,NC
CHARLOTTE MSA, NC
- Investment Strategy : VALUE-ADD
- Investment Type : EQUITY
- Cap-Rate : 7.4%
- TARGET IRR :18.8%
- TARGET AVG CASH ON CASH: 7.5%
- TARGET EQUITY MULTIPLE : 2.08X
- Estimated Hold Period : 1 Month
- Estimated First Distribution : 5/2023
OFFERED BY GVA REAL ESTATE GROUP

Market Overview
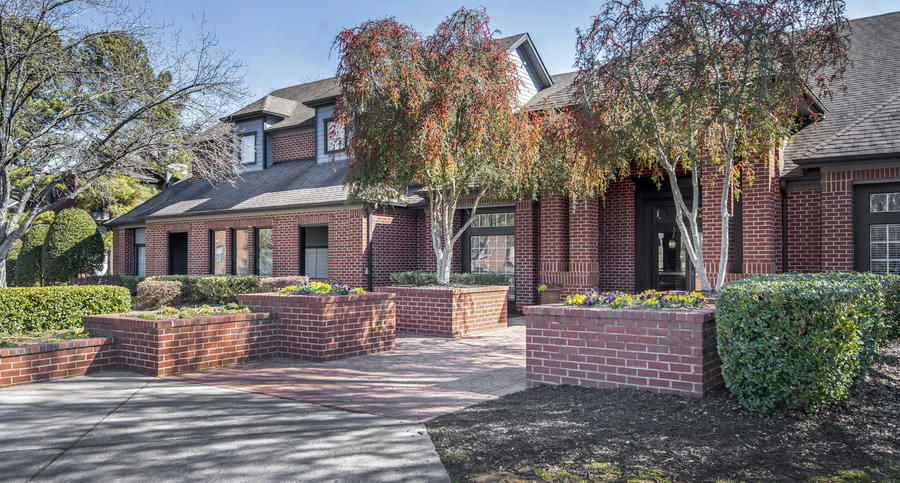
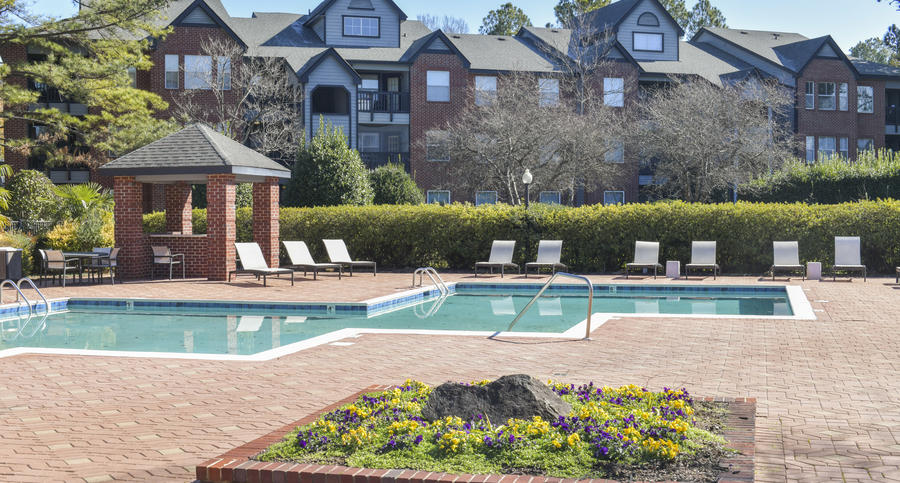
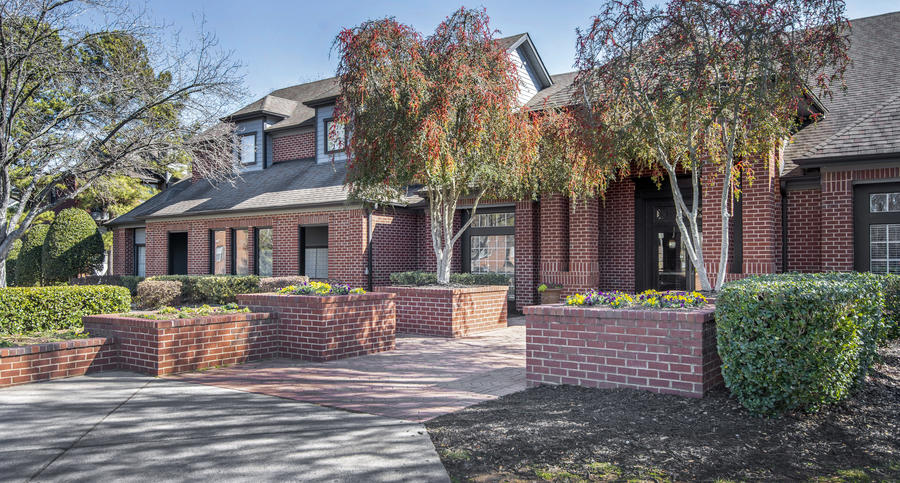
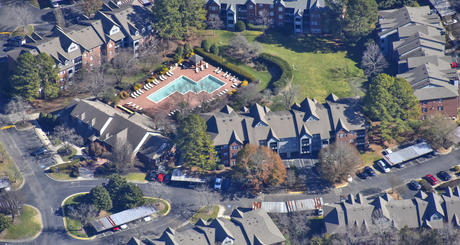
Mission Matthews Place ("the Property") is a 392-unit asset with value-add upside in the highly desirable Matthews submarket of Charlotte.
Charlotte is the largest city in North Carolina and the 15th largest in the U.S., and the growth isn't slowing down. The area welcomes around sixty people per day. The Charlotte MSA is driven by broad-based job growth and has emerged as the primary energy, transportation, and healthcare hub of the region. Although Charlotte is the second-largest banking center in the country behind New York City—surpassing San Fransisco in 2019—insurance, healthcare, and technology companies have reinforced the local economy. The city's notable awards & accolades are:
- #1 best state for business, Forbes December 2020
- #6 U.S market for real estate prospects, 2022 emerging trends in real estate, ULI & PWC
- #6 best places to live, U.S. News & world reports ranking, 2020
- #3 Housing Market in 2021 - realtor.com
- #2 in the country for net migration in 2020
- #1 Millennial Population Increase in the Southeast (20% since 2014)
Submarket Overview
Mission Matthews Place enjoys close proximity to the retail and employment centers, and high-quality schools of Matthews. Area residents enjoy a variety of restaurants and shops, as well as local festivals, a charming historic downtown, and a selection of parks and green spaces. Multifamily in Matthews has seen robust growth and the city is likely to see more development interest in the coming years. This is due to the recent release of long-term plans for a new LYNX Silver Line light rail connecting Matthews to the Charlotte Douglas International Airport by the City of Charlotte and the Charlotte Area Transit System. Mission Matthews Place also benefits from its proximity to Uptown Charlotte (10 miles), the center of the city’s economy. The Property is located in an excellent school district, as Matthews is well known for running among the best schools in the Charlotte MSA. The assigned schools for the Property are Crown Point Elementary - B, Mint Hill Middle - B+, and Butler High - A-. In addition to the premier education district, the site also benefits from superb community demographics. Within three miles of the Property, household income is $102,490, and 49% of the population has earned a bachelor's degree or higher, creating an incredibly reliable resident profile. Demand for this area remains high due to the excellent schools, low crime, variety and abundance of retail options, and immediate access to I-485 and the entirety of the Charlotte MSA.Sources provided by niche.com, U.S. Census Burea, CoStar, and VisitNC.com.
Value-Add
With monthly rental rates of $350 per unit below competing properties, GVA has identified a renovation scope to improve the quality of the asset and bring rents in line with comparable assets in Matthews. The Property is primed for a renovation program that improves each of the 392 units while a more comprehensive renovation program will be implemented for 35% of the units. GVA plans to implement its designer renovation scope, which includes replacing the plumbing & lighting fixtures, adding new cabinet fronts and new cabinet hardware, installing stainless steel appliances, cutting down the kitchen head knockers, adding granite countertops, replacing carpet with vinyl flooring in the living areas, and installing washers & dryers in all
Management
With over 2,000 units under management in Charlotte and 472 units within 5.5 miles of the Property, GVA has created economies of scale in the Charlotte MSA. Furthermore, Mission Matthews Place will be the Company's 12th acquisition in Charlotte which should benefit from the management team's expertise in the area. For example, GVA's comparable property 2.2 miles away has seen an 8.7% increase in renewals and a 20.3% increase in new leases since January of 2022.
Location
Matthews, North Carolina is one of the most coveted submarkets of Charlotte with an overall A rating according to niche.com data. This location provides residents with convenient commute times via regional thoroughfares to several major employment hubs including Uptown Charlotte (10mi; 120K jobs), University City (24.7 mi; 80K jobs), and Ballantyne (16.7 mi; 15K jobs). Additionally, the Property is in the favored Matthews school district (A-rated David W. Butler High School), which attracts many families to the area contributing to a strong renter demographic
| # of Buildings | 1 Main Building (180 units), 4 Duplex Townhomes (8 units) |
| # of Units | 188 |
| First Units Delivered | 7/1/2024 |
| Project Stabilization | 3/1/2026 |
| Land Acquisition Price | $4,861,401 |
| Total Development Budget | $52,847,396 |
check Return Potential - Offers an attractive target internal rate of return of 23%+ and target equity multiple of 2.01x.
check Desirable Location - Prosper, Texas is an affluent, high-growth North Dallas suburb. The Project is located one mile north of the largest resort under development in the country (Omni PGA Frisco Resort).
check Strong Demand - Favorable tailwinds with 10,000 Baby Boomers turning 65 every day through 2030. The Active Adult segment is an underserved niche in the senior housing continuum.
check Proven Product - The Alders brand is known for its upscale finishes, gracious spaces, and fostering an active sense of community for our residents. Two of the three properties the Sponsor has completed are stabilized, and the third was sold in March of this year. The fourth property broke ground in Q2 2021 and is due to deliver the first units later this year.
check Experienced Team - The fifth Alders property in Texas, the fourth Alders project constructed by the General Contractor, and Sponsor intends to engage Cushman & Wakefield to market and manage the community through lease-up and stabilization.
Business Plan
Built in 1994, Mission Matthews Place is a high-quality asset that has been adequately maintained by the seller and past ownership. GVA has identified opportunities to increase the value of the asset by implementing a more active management team with expertise in Charlotte, executing a renovation scope to improve the quality of the asset, and moving rents to market with additional rental upside through the identified renovation program. The Sponsor has experience executing on a similar business plan in Charlotte on a nearby property.
GVA has budgeted to invest $3,519,234 into both the interior and exterior of the Property.
Unit Renovations: With 137 true classic units on the Property, GVA plans to invest approximately $10,800 per unit on extensive renovations across those units. There is ample renovation upside across the remaining 255 units and GVA plans to invest approximately $4,900 per unit on those renovations. The GVA designer plus renovation scope includes new plumbing & lighting fixtures, adding new shaker cabinets with pulls, a stainless steel appliance package, granite countertops, wood-like flooring in living areas, installing washer/dryers in all units, and a new paint scheme.
Exterior Renovations: The renovation plan calls for investing $395,000 across the exterior which includes improving the landscaping, enhancing the signage, upgrading the leasing office, and updating the pool area including new pool furniture.
GVA plans to acquire the Property with a three-year, floating-rate loan and two one-year extension options. The business plan calls for a capital event to occur within 3 years of ownership from either a sale or cash-out refinance, allowing ample time to pay off the loan before maturity.
CapEx Breakdown
| $ Amount | Per Unit | |
| Interior Renovations | ||
| Vinyl Flooring | $210,808 | $538 |
| Stainless Steel Appliances | $313,628 | $538 |
| Granite Counters | $1,176,000 | $3,000 |
| Cabinet Refacing | $171,250 | $437 |
| Plumbing & Lighting Fixtures | $205,500 | $524 |
| Paint & Labor | $392,000 | $1,000 |
| Design Fees | $39,200 | $100 |
| Total Interior Renovation Costs | $2,508,386 | $6,399 |
| Exterior Renovations | ||
| Landscaping | $25,000 | $64 |
| Signage | $25,000 | $64 |
| Office Refresh | $25,000 | $64 |
| Pool Refresh | $20,000 | $51 |
| Miscellaneous | $300,000 | $765 |
| Total Exterior Renovation Costs | $395,000 | $1,008 |
| Other Costs | ||
| CM Fee | $319,939 | $816 |
| Operating Carry | $100,000 | $255 |
| Miscellaneous | $196,000 | $500 |
| Grand Total | $3,519,324 | $8,978 |
-
Property Details
Mission Matthews Place ("the Property") is a well-built 1994 vintage multifamily asset conveniently located in the heart of Matthews, one of the hottest submarkets of Charlotte. The Property is situated along East Independence Boulevard, one of the primary east-west thoroughfares, which connects Matthews with Uptown Charlotte (10 miles). This location offers residents access to multiple economic demand drivers, retail, and job opportunities throughout the Matthews submarket and the Charlotte MSA. Additionally, the Matthews submarket has impressive demographics and multi-family fundamentals, positioning the Property for growth for years to come.
Unit Mix Unit Type # of Units Avg SF/Unit Avg Rent (In-Place) Avg Rent (Post-Reno) Avg Rent Per SF (In-Place) Avg Rent Per SF (Post-Reno) 1x1 63 685 $1,027 $1,429 1.50 $2.09 1x1 84 774 $1,067 $1,429 $1,50 $1.87 1x1 Loft 36 946 $1,146 $1,499 $1.21 $1.59 2x2 92 965 $1,197 $1,579 $1.24 $1.64 2x2 85 1,038 $1,273 $1,619 $1.23 $1.46 3x2 32 1,208 $1,451 $1.20 $1.46 Total/Averages 392 913 $1,174 $1,544 $1.29 $1.69 -
Comparables
Lease Comparables
Sardis Place at Matthews Park 2300 Matthews Reserve Averages Subject (Post-Reno) Year Built 1989 1985 1997 1990 1994 Class B B B B+ A- # of Units 420 384 212 339 392 Average Unit Size 983 SF 842 SF 942 SF 922 SF 913 SF Levels 2 and 3 2 and 3 2 and 3 2 and 3 2 and 3 Occupancy 92.90% 97.10% 98.10% 96% 92% Distance from Subject 0.1 mi v0.7 mi 2.3 mi 1.0 mi $/Unit (1x1) $1,250 $1,250 $1,429 SF (1x1) 630 630 685 $/SF (1x1) $1.98 $1.98 $2.09 $/Unit (2x2) $1,551 $1,698 $1,652 $1,634 $1,619 SF (2x2) 1,095 980 1,039 1,038 1,038 $/Unit (3x2) $2,085 $1,680 $1,863 $1,769
Sales Comparables
Active Adult Sales Comps
The Cove at Matthews Matthews Square Magnolia Heights Creekside at Matthews Montford at Madison Park Averages Subject (Going-in) Subject (At-Exit) Date Sold 6/3/2022 9/29/2021 12/30/2020 6/30/2021 1/5/2022 Year Built 1988 2020 2004 2000 1999 2002 1994 1994 # of Units 288 350 174 240 204 251 392 392 Average Unit Size 775 SF 1,000 SF 1,121 SF 1,016 SF 1,075 SF 1,064 SF 1,007 SF 913 SF 913 SF Sale Price $60,250,000 $92,500,000 $43,000,000 $58,000,000 $62,000,000 $63,150,000 92,000,000 $148,259,387 $/Unit $209,201 $264,286 $247,126 $241,667 $303,922 $253,240 $234,694 $378,213 $/SF $270/SF $264/SF $220/SF $225/SF $285/SF $253/SF $257/SF $414/SF Cap Rate 3.65% 3.65% 4.18% 4.50% Building Size(1) 223,200 SF 350,222 SF 195,103 SF 258,060 SF 217,180 SF 235,817 SF 248,753 SF 357,880 SF 357,880 SF Distance from Subject 1.8 mi 3.1 mi 4.9 mi 3.9 mi 6.9 mi 4.1 mi Address 1701 Gander Cove Lane, Matthews, NC 4010 Waiting Street, Matthews, NC 3720 Wendwood Lane, Charlotte, NC 12825 Vinings Creek Dr, Matthews, NC 1420 Estates Avenue, Charlotte, NC
Financial Projections
-
Sources and Uses
Total Capitalization
Sources of Funds $ Amount $/Unit Debt $70,437,000 $179,686 GP Investor Equity(1) $6,143,339 $15,672 LP Investor Equity $26,480,761 $67,553 Total Sources of Funds $103,061,100 $262,911 -
Debt Assumptions
The expected terms of the debt financing are as follows:
- Lender: ReadyCapital
- Term:3 Years with two 12-month extension options
- LTC:68.3%
- Estimated Proceeds: $70,437,000
- Interest Type: Floating
- Annual Interest Rate: 5.25%
- Spread above one-month SOFR: 4.75%
- Interest-Only Period:36 Months
- Annual Interest Rate: WSJ Prime + 50bps with Floor Rate of 4.75%
- Amortization: 30 Years during extension options
- Estimated Proceeds: $33,000,000
- Prepayment Terms: Open prepay, subject to Minimum Interest and Exit Fee requirements
- Extension Requirements:No prior Events of Default or material adverse effect during the initial Loan Term; Payment of the Extension Fee; Maximum LTV of 70% subject to updated Lender engaged valuations; Minimum occupancy of 94%; Minimum debt yield of 6.75%; and Satisfactory renewal of interest rate cap (if applicable)
- Modeled Refinance: Yes
- Refinance Information: Agency
- Lender: Fannie/Freddie
- Term: 5 Years
- Estimated Proceeds: $88,519,971
- Interest Type: Floating
- Interest Rate: All-in rate of 4.0%
- Interest-Only Period:60 Months
- Amortization:30 Years
(1). The Sponsor has secured an interest rate cap with a 2.75% strike rate for the debt in place, capping the max interest rate at 7.50%
(2) The Loan is cross-collateralized with another property named Waterford Hills Apartments. The Waterford Property is located at 6219 Waterford Hills Drive, Charlotte, North Carolina 28269. Prospective investors are encouraged to read the PPM which provides more details on the cross-collateralization
-
Distributions
GVA Real Estate Group intends to make distributions from GVA PRO LLC as follows:
(1). To the Investors, pari passu, all operating cash flows to an 8.0% IRR.
(2). 22.2% promote to Sponsor to a 16.0% IRR (70% to Investors / 30% to Sponsor).
(3). 44.4% promote to Sponsor thereafter (50% to Investors / 50% to Sponsor).
1. GVA Real Estate Group intends to make distributions to investors after the payment of the company's liabilities (loan payments, operating expenses, and other fees as more specifically set forth in the LLC agreements, in addition to any member loans or returns due on member loan).
2. Distributions are expected to start in May 2023 and are projected to continue on a quarterly basis thereafter. Distributions are at the discretion of GVA Real Estate Group, who may decide to delay distributions for any reason, including maintenance or capital reserves.
3. GVA Real Estate Group will receive a promoted/carried interest as indicated above.
Cash Flow Summary
Year 1 Year 2 Year 3 Year 4 Year 5 Effective Gross Revenue $6,350,498 $7,478,517 $8,278,712 $8,711,893 $9,088,193 Total Operating Expenses $2,300,147 $2,524,243 $2,581,822 $2,627,146 $2,710,278 Net Operating Income $4,050,351 $4,954,274 $5,696,890 $6,084,746 $6,377,914 Project-Level Cash Flows Year 0 Year 1 Year 2 Year 3 Year 4 Year 5 Net Cash Flow ($32,624,100) $655,709 $1,216,470 $18,449,639 $2,438,437 $63,422,710 Investor-Level Cash Flows Year 0 Year 1 Year 2 Year 3 Year 4 Year 5 Net Cash Flow ($5,000,000) $49,495 $135,437 $2,776,609 $322,717 $7,111,405 Investor-Level Cash Flows - Hypothetical $50,000 Investment Year 0 Year 1 Year 2 Year 3 Year 4 Year 5 Net Cash Flow ($50,000) $495 $1,354 $27,766 $3,227 $71,114
(1). (1) Reliance Technologies, LLC and its affiliates do not provide any assurance of returns. Returns presented are net of all fees. Please carefully review the Fees and Disclaimers sections below for additional information concerning Sponsor's use or projected returns and fees paid to Sponsor and Reliance Technologies, LLC. -
Fees
Certain fees and compensation will be paid over the life of the transaction; please refer to GVA Real Estate Group's materials for details. The following fees and compensation will be paid
One-Time Fees:
Type of Fee Amount of Fee Received By Paid From Notes Acquisition Fee 2% of Purchase Price GVA Real Estate Capitalization Construction Management Fee 10% of Hard Costs GVA Real Estate Capitalization Technology Solution Licensing Fee Flat one-time licensing fees of $15,000 plus $1,500 per each prospective investor onboarded by Sponsor through its license and use of EP Technologies’ Technology Solution Reliance Technologies, LLC Capitalization Recurring Fees: Type of Fee Amount of Fee Received By Paid From Asset Management Fee 1.5% of Total Revenues GVA Real Estate Cash Flow Property Management Fee> 3.5% of Total Revenues GVA Real Estate Cash Flow Administration Solution Licensing Fee Flat quarterly licensing fee of $125 per investor serviced by Sponsor through the license and use of EP Technologies' Administration Solution Reliance Technologies, LLC Cash Flow
(1). Fees may be deferred to reduce impact to investor distributions.
(2). Hard Costs + Hard Costs contingency + FF&E
(3). Please see the Fees and Disclaimers sections below for additional information concerning fees paid to Reliance Technologies, LLC.
| Uses of Funds | $ Amount | $/Unit |
| Purchase Price | $92,000,000 | $234,694 |
| Acquisition Fee | $1,840,000 | $4,694 |
| Loan Fee | $704,370 | $1,797 |
| Closing Costs | $423,328 | $1,080 |
| CapEx | $3,519,324 | $8,978 |
| Working Capital | $3,753,193 | $9,574 |
| Interest Rate Cap | $820,885 | $2,094 |
| Total Uses of Funds | $103,061,100 | $262,911 |
(1). The Sponsor's equity contribution may consist of friends and family equity and equity from funds controlled by the Sponsor.
(2). Please refer to PPM for more details.
Management

GVA Real Estate Group
GVA Real Estate Group was founded in 2015. GVA is an Austin-based vertically integrated real estate company committed to creating value in the multi-family real estate sector. The company specializes in conventional as well as affordable opportunities, paying particular attention to expanding sub-markets. GVA currently owns 138 properties, 25,796 units, and has $4.9B in assets under management in Texas, Tennessee, the Carolinas, Georgia, Oklahoma, and Colorado. GVA has sold 70 properties for an average gross IRR of 45.2%. GVA has refinanced 27 transactions returning, on average, 104.5% of equity to its investors while continuing to hold the assets and distribute property cash flows to investors. At GVA, their investment strategy is simple, find opportunities that can yield above-market cash flow once stabilized while generating capital appreciation in the short and long term.
-
GVA Real Estate Group's Track Record
Property Name City State Units Year Built Date Acquired Sale Date IRR Clemson Clemson SC 146 2011 12/31/2013 12/1/2016 137% Newing Oak Austin TX> 20 1970 4/1/2013 2/1/2018 43% Sola Flats Austin TX 16 1972 2/1/2012 4/4/2018 36% Midtown Flats Austin TX 41 1972 4/15/2015 4/30/2018 75% Mueller Place TX 86 1969 8/15/2015 7/31/2018 28% Highland Flats Austin TX 24 1972 5/8/2015 8/21/2018 39% Harmon Square Austin TX 74 1968 12/1/2017 10/4/2018 133% Soco Flats Austin TX 20 1972 2/1/2015 10/15/2018 56% Vanitas Austin TX 126 1971 9/15/2016 10/23/2018 29% Velo Austin TX 70 1979 11/30/2016 10/26/2018 22% Sum/Average 48 9,656 1976 11/10/2017 10/15/2020 45%
Buying Partners
Buyer's Agent
An experienced local, licensed real estate broker/agent will represent you in this transaction. They will negotiate on your behalf, from your first offer through closing.
- Properties listed on Reliance are displayed from MLS data and are chosen by Roofstock for their investment potential—often as soon as it hits the market.
- You can be represented in the purchase by a Roofstock-affiliated real estate agent who is an expert in investment properties and knows the local market.
- Your offer can have an inspection contingency, which allows you to obtain a home inspection in order to review the property's condition.
- Upon introduction to the Roofstock-affiliated agent, you may discuss your investing strategy with the agent who will assist you in the buying process
Disclaimers
Sponsor's Projects and Targets
*Assumptions and projections included in the information on this Page, including pro forma projections (collectively “Projections”) were provided by the Sponsor or an affiliate thereof and are not reflective of the position or opinions of, nor are they endorsed by, Reliance Technologies, LLC or its affiliates, or any other person or entity other than the Sponsor or its affiliates. Reliance Technologies, LLC and its affiliates
do not provide any assurance of returns or the accuracy or reasonableness of the Projections provided by the Sponsor or its affiliates. There can be no assurance that the Sponsor’s methodology used for calculating any Projections, including Target IRR, Target Annualized Cash-on-Cash Return, and Target Equity Multiple (“Targets”), are appropriate or adequate. The Sponsor’s Projections and Targets are hypothetical, are not based on actual investment results, and are presented solely for the purpose of providing insight into the Sponsor’s investment objectives, detailing its anticipated risk and reward characteristics and for establishing a benchmark for future evaluation of the Sponsor’s performance. The Sponsor’s Projections and Targets are not a predictor, projection or guarantee of future performance. There can be no assurance that the Sponsor's Projections or Targets will be met or that the Sponsor will be successful in meeting these Projections and Targets. Projections and Target returns should not be used as a primary basis for an investor’s decision to invest.
No Approval, Opinion or Representation, or Warranty by Reliance Technologies, LLC or it Affiliates
The information on this Page, including the Sponsor's offering documentation, which may include without limitation the Private Placement Memorandum, Operating or Limited Partnership Agreement, Subscription Agreement, the Project Summary and all exhibits and other documents attached thereto or referenced therein (collectively, the “Investment Documents”) was provided by the Sponsor or an affiliate thereof.
Reliance Technologies, LLC makes no representations or warranties as to the accuracy of such information and accepts no liability therefor. No part of the information on this Page is intended to be binding on Reliance Technologies, LLC or its affiliates, or to supersede any of the Sponsor's Investment Documents.
The opinions expressed on this page are solely the opinions of the Sponsor and its affiliates and none of the opinions expressed on this Page are the opinions of, nor are they endorsed by, Reliance Technologies, LLC or its affiliates.
Sponsor's Information Qualified by Investment Documents
The Information on this Page, including of the principal terms of the Sponsor's offering, is qualified in its entirety by reference to the more complete information about the offering contained in the Sponsor's Investment Documents. The information on this Page is not complete, and each prospective investor should carefully read all of the Investment Documents and any supplements thereto, copies of which are available by clicking the links above or upon request, before deciding whether to make an investment. The information on this page should not be used as a primary basis for an investor's decision to invest. In the event of an inconsistency between the information on this Page and the Investment Documents, investors should rely on the information contained in the Investment Documents. The information on this Page and the information in the Investment Documents are subject to last minute changes up to the closing date at the sole discretion of the Sponsor and its affiliates.
Risk of Investment
This real estate investment is speculative and involves substantial risk. There can be no assurances that all or any of the assumptions will be true or that actual performance will bear any relation to the hypothetical illustrations herein, and no guarantee or representation is made that investment objectives of the Sponsor will be achieved. In the event that actual performance is below the Sponsor's Targets, your investment could be materially and adversely affected, and there can be no assurance that investors will not suffer significant losses. A loss of part or all of the principal value of your investment may occur. You should not invest unless you can readily bear the consequences of such loss. Please see the Sponsor's Investment Documents for additional information, including the Sponsor's discussion concerning risk factors
Risk of Forward-Looking Statements
Forward-looking statements are found here and in the applicable Investment Documents and may include words like “expects,” “intends,” “anticipates,” “estimates” and other similar words. These statements are intended to convey the Project Sponsor's projections or expectations as of the date made. These statements are inherently subject to a variety of risks and uncertainties. Please see the applicable Investment Documents for disclosure relating to forward-looking statements. All forward-looking statements attributable to the Sponsor or its affiliates apply only as of the date of the offering and are expressly qualified in their entirety by the cautionary statements included elsewhere in the Investment Documents. Any financial projections are preliminary and subject to change; the Sponsor undertakes no obligation to update or revise these forward-looking statements to reflect events or circumstances that arise after the date made or to reflect the occurrence of unanticipated events. Inevitably, some assumptions will not materialize, and unanticipated events and circumstances may affect the ultimate financial results. Projections are inherently subject to substantial and numerous uncertainties and to a wide variety of significant business, economic and competitive risks, and the assumptions underlying the projections may be inaccurate in any material respect. Therefore, the actual results achieved may vary significantly from the forecasts, and the variations may be material.
Sponsor's use of Debt
A substantial portion of the total acquisition for the Property will be paid with borrowed funds, i.e., debt. There can be no assurance that the Sponsor will secure debt on the rates and terms noted above, or at all. All of the Sponsor's estimated rates and terms of the debt financing are subject to lender approval, including but not limited to the annual interest rate and possible increases in capital reserve requirements for funds to be held in a lender-controlled capital reserve account. The use of borrowed money to acquire real estate is referred to as leveraging. Leveraging increases the risk of loss. If the Sponsor were unable to pay the payments on the borrowed funds (called a "default"), the lender might foreclose, and the Sponsor could lose its investment in its property.
In addition, unless the debt provides for a fixed rate of interest during the term of the loan and/or any subsequent extensions, the total amount of interest paid over the term of the debt will increase by the same amount as the related index. For example, if the index rate increases by 0.50% (50 basis points) the interest rate on the loan will increase by the same amount. The amount of such interest rate increases may be capped either by its terms or as the result of the Sponsor entering into an arrangement that caps the interest rate with respect to the debt at a particular rate.
Sponsor's Offering is Not Registered
The interests offered by the Sponsor will not be registered under the Securities Act of 1933, as amended (the “Securities Act”) in reliance upon the exemptions from registration pursuant to Rule 506(c) of Regulation D as promulgated under the Securities Act (“Private Placement.”). In addition, the interests will not be registered under any state securities laws in reliance on exemptions from registration. Such interests are subject to restrictions on transferability and resale and may not be transferred or resold except as permitted under applicable state and federal securities laws pursuant to registration or an available exemption. All Private Placements on the RelianceProperties Platform are intended solely for “Accredited Investors,” as that term is defined Rule 501(a) of the Securities Act. Prospective investors must certify that they are Accredited Investors and provide either certain supporting documents or third party verification, and must acknowledge that they have received and read all investment materials.
Reliance Technologies, LLC Fees and Conflicts
Reliance Technologies, LLC, an affiliate of RelianceProperties, operates the RelianceProperties Platform. Reliance Technologies, LLC charges a fixed, non-percentage-based licensing fee for real estate companies and their sponsors to license and use the Reliance Technologies LLC's proprietary Platform, including one-time flat licensing fees for its Technology Solution and an ongoing quarterly flat licensing fees for its Administration Solution. An estimate of the Technology Solution licensing fee is included in the Closing Costs above and is intended to be capitalized into the transaction at the discretion of the Sponsor. The licensing fees received by Reliance Technologies, LLC are disclosed in the relevant operating agreement(s). Additionally, from time to time, employees of Reliance Technologies, LL C and its affiliates invest in Sponsor's offering. Reliance Technologies LLC's receipt of licensing fees and its employee's investments in Sponsor's offering creates a conflict of interest between EquinoxProperties and its affiliates, and investors or prospective investors.
No Investment Advice
RelianceProperties and Reliance Technologies, LLC are not a registered broker-dealer, investment adviser or crowdfunding portal. Nothing on this Page should not be regarded as investment advice, either on behalf of a particular security or regarding an overall investment strategy, a recommendation, an offer to sell, or a solicitation of or an offer to buy any security. Advice from a securities professional is strongly advised,
and we recommend that you consult with a financial advisor, attorney, accountant, and any other professional that can help you to understand and assess the risks associated with any real estate investment.
For additional information on risks and disclosures visit https://www.reliancepropertiesrealtor.com/investment-disclosure.php.