WAITLIST
- Total Financial Projection :
- $75, 837, 983
- Minimum Investment : $5,000
- Funding :
100% fully Funded
- location_city USE: MULTIFAMILY
- location_on Dobson Station
MESA, AZ
- Investment Strategy : VALUE-ADD
- Investment Type : EQUITY
- Cap-Rate : 5.3%
- TARGET IRR :23.2%%
- TARGET EQUITY MULTIPLE : 1.54X
- Estimated Hold Period : 1 Month
- Estimated First Distribution :9/2024
OFFERED BY STARPOINT PROPERTIES
* This opportunity is fully funded at this time.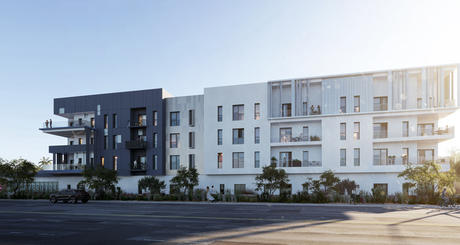


Market Overview
StarPoint Properties and its affiliates are currently accepting equity commitments for Dobson Station (the “Project”), a 245-unit multifamily development located in Mesa, Arizona. Please refer to the Offering Documentation for specific details.Phoenix is a Tier-1, rapidly growing market. The Phoenix MSA boasts 5.1M people, with a population growth of 20% since 2010. The unemployment rate was 3.2% as of the end of 2021, with YoY job growth of 5.6%. Over 30 Fortune 500 companies are headquartered or have major operations in Phoenix, and the Greater Phoenix Economic Council reported that 270 global companies are seeking to add or increase their presence. More employment opportunities in the Valley combined with a lower cost of living compared to other large metros (Rent Share of Wallet is 31.9%) will continue to attract new residents, creating historic housing demand.
Phoenix multifamily rents have increased by over 20% YoY in 2021, with substantial growth forecasted through 2026. The vacancy rate across the market is currently below 6% and is forecast to end 2022 at 97.0%, 130 basis points higher than the preceding five-year average.
Submarket Overview
Mesa, with over 500K residents, is the 37th largest city in the US (larger than Miami, St. Louis, and Minneapolis) & the 2nd largest city in the Phoenix MSA, with over 40K students enrolled in 10 colleges and universities within the city limits.In 2Q22, Boeing announced that it will relocate its headquarters from Chicago to Arlington. In addition to its headquarters, Boeing plans to develop research and technology. Boeing cited the access to world-class engineering and technical talent as a reason for their move. Raytheon also recently announced that it will relocate its global headquarters from Massachusetts to Arlington in 3Q22, a move that will see four of the top five U.S.-based aerospace and defense contractors headquartered in Virginia. Raytheon is the second-largest defense company in the world after Lockheed Martin.
The Competitive Market Area ("CMA") demographics are as follows (the CMA is defined as the area of Mesa north of Route 60):
- 375K people in 143K total households, with 143K people in the workforce.
- Median age of 36, with a median income of $53K
- 42% of the population are renters.
- High job density, with 123K jobs in the CMA.
- 89% of people over age 25 have a high school diploma, while 27% have a bachelor's degree or higher.
Dobson Station is adjacent to community-serving retail, public transportation, and higher education options, and is a short drive from the main highways of Phoenix.
market
Phoenix is one of the country's fastest-growing markets. Urban Land Institute’s 2022 Emerging Trends in Real Estate ranked the MSA as a top migration destination for people & companies. The Phoenix MSA boasts 5.1M people and an unemployment rate of 3.2%, and rents increased in the Phoenix multifamily market by over 20% YoY in 2021. The vacancy rate across the market is sub-6%, with 2021 absorption of 11.9K units against delivery of 9.8K units
Location
The site is an infill location adjacent to services, amenities, and a high-traffic count intersection. The Property is within walking distance to the light rail into downtown Tempe and is located less than 2 miles from the 101, 202, and 60 highways, providing direct access to the greater Phoenix area.
Potential Efficiencies
The development will benefit from a GPLET (property tax abatement) agreement with the City of Mesa for 8 years after construction, which will generate significant tax savings and add over $4M in present value to the exit price. The Project also includes optionality for an Opportunity Zone investment, after sale, with a generational opportunity to pay no capital gains tax on future profits.
| # of Units | 245 |
| # of Buildings | 1 |
| First Units Delivered | 7/1/2024 |
| Project Stabilization | 5/1/2025 |
| Return on Cost | 6.7% |
| Acquisition Price | $6,930,000 |
check StarPoint Properties and its affiliates have secured the land and entitlements to build the Property for $75.8M, or $310K per unit, including a 13% total contingency.
check The Property is located in Mesa, AZ, a city of 500K people in the greater Phoenix MSA, and is situated within two miles of the SR-101, SR-202, and US-60 freeways.
check The greater Phoenix area has seen population growth of 20% since 2010, boasts an overall unemployment rate of 3.2%, and has a low rent-to-income ratio that indicates ample room for strong rent growth relative to other Tier 1 markets.
check Additionally, the site is a five-minute walk from a Metro light-rail stop, which provides service into Phoenix and Tempe, and is adjacent to community-serving retail and several local college campuses.
check The building will include modern amenities such as a swimming pool, fitness center, clubhouse, coworking facility, and group kitchen.
check The exit strategy is to sell the Project to either an Opportunity Zone (OZ) fund or the general market at or prior to the time when the Project receives its Temporary Certificate of Occupancy (TCO), which is anticipated to occur in mid-2024.
check Investors in the development will benefit from a quick exit and a sale to a motivated buyer pool, which can pay a premium due to the significant tax advantages of the OZ program and benefit from investing in assets completely removed of construction risk.
Business Plan
The Manager will complete the design and construction of the Project as described below and expects to sell the asset to either an Opportunity Zone (OZ) fund or the general market at or prior to the time when the Project receives its Temporary Certificate of Occupancy (TCO), which is anticipated to occur in mid-2024. Investors in the development will benefit from a quick exit and a sale to a motivated buyer pool, with a StarPoint Right of First Refusal, which can pay a premium due to the significant tax advantages of the OZ program and benefit from investing in assets completely removed of construction risk. The returns will go beyond profits, with full implementation of policies and practices to create positive environmental, social, and governance impacts.
Project Description
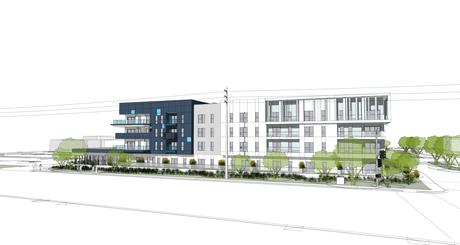
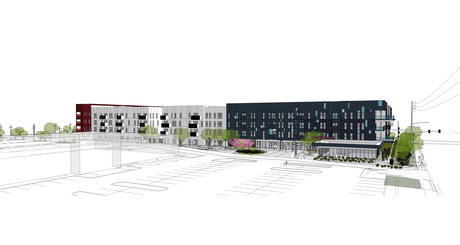
Upon completion, Dobson Station will consist of four stories of Type V-A construction. The building will include modern amenities such as a swimming pool, fitness center, clubhouse, coworking facility, and group kitchen. The Project will also include 369 parking stalls, split between tuck-under and on-grade parking. The unit mix will consist of Studios, 1-Bed/1-Bath, and 2-Bed/2-Bath with an average unit size of 865 SF — well above the market average.
Location Description
Dobson Station boasts an exceptional location near Phoenix’s main transportation arteries. Located one mile from SR-101, one and ½ miles from SR-202, and two miles from US-60, future residents will have incredible access to the region’s polycentric job centers and amenities. Notably, located 5 minutes from the nearby Metro Phoenix light rail stop, residents will have easy, car-free access to Downtown Mesa, Arizona State University, Phoenix Sky Harbor Airport, and Downtown Phoenix. Additionally, the Project is directly adjacent to a Safeway neighborhood center with multiple retail amenities and boasts a walk score of 78 and a bike score of 94.
Development Costs
| $ Amount | Per Unit | ||||
| Land Price | $6,930,000 | $28,286 | |||
| Acquisition Costs | $34,650 | $141 | |||
| Total Land Costs | $6,964,650 | $28,427 | |||
| bHard Costs | |||||
| Construction | $44,291,907 | $180,783 | |||
| General Contractor's Fee & Overhead | $1,664,009 | $6,792 | |||
| GC Contingency | $2,049,878 | $8,367 | |||
| Owner Inflation | $4,802,578 | $19,602 | |||
| Total Hard Costs | $52,808,371 | $215,544 | |||
| Soft consist | |||||
| Municipal Fees & Permits | $1,570,805 | $6,411 | |||
| Consultants (DD, Entitlements, A&E) | $2,050,000 | $8,367 | |||
| Marketing & FF&E | $537,000 | $2,192 | |||
| Owners Insurance | $650,000 | $2,653 | |||
| Legal & Accounting | $140,000 | $571 | |||
| Property Taxes | $247,581 | $1,011 | |||
| Pre-Opening Expense / Operating Deficit | $1,434,671 | $5,856 | |||
| Total Softs Costs | $6,630,057 | $27,061 | |||
| Financing Costs | |||||
| Construction Interest | $2,765,991 | $11,290 | |||
| Financing Costs | $859,992 | $3,510 | |||
| Total Financing Costs | $3,625,983 | $14,800 | |||
| Other Costs | |||||
| Developers Fee | $2,046,619 | $8,354 | |||
| Construction Management Fee | $593,800 | $2,424 | |||
| Owner's Contingency | $3,168,502 | $12,933 | |||
| Total Other Costs | $5,808,921 | $23,710 | |||
| Grand Total | $75,837,983 | $309,543 | |||
-
Property Details
The Project, located near the intersection of Dobson Road and Main Street, is situated only one mile away from the SR-101 freeway and a five-minute walk from a Metro light-rail stop. Fully entitled, construction is scheduled to begin in mid-2022, with the Project exit expected in mid-2024.
Unit Mix
Unit Type # of Units Avg SF / Unit $ / Unit $ / SF % of Total Studio 25 582 $1,298 $2.23 10% 1x1 127 784 $1,513 $1.93 52% 2x2 93 1052 $1,940 $1.84 38% Total/Averages 245 865 $1,653 $1.91 100% 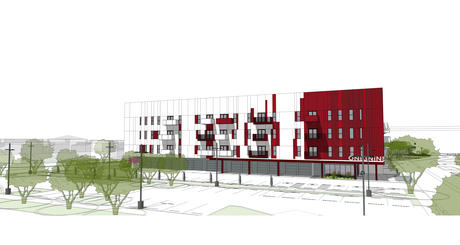
-
Comparables
Lease Comparables
Connexus Corporation Stg International Radiance Technologies Brown & Root Industrial Services American Association for Homecare Silicon Valley Bank Monument Economics Group Averages Subject Year Built 1985 2001 1980 1990 1970 1981 1981 1984 1970 Tenant Lease Size 2,354 SF 8,078 SF 7,909 SF 3,798 SF 1,516 SF 4,563 SF 4,790 SF 4,715 SF Building NRSF 221,389 SF 233,446 SF 451,572 SF 398,329 SF 316,353 SF 559,479 SF 559,479 SF 391,435 SF 68,156 SF Building NRSF 221,389 SF 233,446 SF 451,572 SF 398,329 SF 316,353 SF 559,479 SF 559,479 SF 391,435 SF 68,156 SF Rental Rate $33.00/SF $35.00/SF $46.50/SF $47.00/SF $54.00/SF $55.50/SF $56.42/SF $46.77/SF $40.79/SF Lease Type Modified Gross Modified Gross Modified Gross Modified Gross Modified Gross Modified Gross Modified Gross Modified Gross Address 2800 Shirlington Rd 2900 South Quincy 1550 Crystal Drive 2451 Crystal Drive 1400 Crystal Drive 1000 Wilson Blvd 1000 Wilson Blvd 2300 9th Street South Distance from Subject 1.5 miles 1.7 miles 1.8 miles 2.0 miles 1.8 miles 2.2 miles 2.2 miles 1.8 miles
Sales Comparables
1300 Wilson Blvd 1400 crystal 2100-2120 S Washington Blvd Presidential Tower 1300 17th St N Averages Subject(Total Budget) Date Sold 2/1/2022 12/1/2021 9/1/2021 5/1/2019 1/1/2018 Year Built 1968 2013 1987 1972 1980 1984 1970 NRSF 363,112 SF 316,353 SF 369,215 SF 383,524 SF 398,000 SF 366,041 SF 68,786 SF Sale Price $245,000,000 $203,000,000 $204,400,000 $123,230,000 $250,000,000 $205,126,000 $34,361,553 $/SF $675/SF $642/SF $554/SF $321/SF $628/SF $564/SF $501/SF Cap Rate 5.25% 5.45% 5.50% 5.75% 5.60% 5.51% 7.10% Address 1300 Wilson Blvd 1400 Crystal Drive 2100-2120 S Washington Blvd 2550 S Clark 1300 17th St N 2300 9th Street South Distance from Subject 2.1 miles 1.8 miles 0.6 miles 1.9 miles 2.1 miles 1.7 miles
Financial Projections
-
Sources and Uses
Total Capitalization
Sources of Funds $ Amount $/Unit Debt $48,362,153 $197,397 GP Investor Equity $1,358,400 $5,544 LP Investor Equity $26,117,430 $106,602 Total Sources of Funds $75,837,983 $309,543 Uses of Funds $ Amount $/SF Site Acquisition Costs $6,964,650 $28,427 Hard Costs $48,005,794 $195,942 Soft Costs $9,270,476 $37,839 Owner's Inflation & Contingency $7,971,080 $32,535 Capitalized Interest Expense $2,765,991 $11,290 Finance Fees & Other $859,992 $3,510 Total Uses of Funds $75,837,983 $309,543 -
Debt Assumptions
The expected terms of the debt financing are as follows:
- Term : 5 Years
- Loan-To-Value: 63.0%
- Estimated Proceeds:$47,807,800
- Interest Type : Actual/360 up until the Full Funding Date and 30/360 thereafter
- Spread Above one-month SOFR :3.25%
- Interest-only Period: : Full Term
- Amortization:N/A
- Prepayment Terms: Months 1-24: Closed to Prepayment; Months 25-60: Open at Par.
- Extension Requirements : N/A
- Modeled Refinance : No
A substantial portion of the total acquisition for the Property will be paid with borrowed funds, i.e., debt. Please carefully review the Disclaimers section below for additional information concerning the Sponsors use of debt
-
Distributions
The Manager intends to make distributions as follows:
(1). To the Investors, pari passu, all operating cash flows to an 10.0% IRR;
(2). 80% / 20% (80% to Investors / 20% to Promoted/Carried Interest) of excess cash flow to a 14.0% IRR;
(3). 70% / 30% (70% to Investors / 30% to Promote/Carried Interest) of excess cash flow thereafter.
The Manager intends to make distributions to investors after the payment of the company's liabilities (loan payments, operating expenses, and other fees as more specifically set forth in the Offering Documentation, in addition to any member loans or returns due on member loans). Distributions are at the discretion of the Manager, who may decide to delay distributions for any reason, including maintenance or capital reserves.
The Manager will receive a promoted/carried interest as indicated above.
Projected Cash Flow Summary
Project-Level Cash Flows Year 0 Year 1 Year 2 Year 3 Net Cash Flow ($27,475,830) $0 $0 $43,367,640 Investor-Level Cash Flows Year 0 Year 1 Year 2 Year 3 Net Cash Flow ($10,222,222) $0 $0 $15,783,923 Investor-Level Cash Flows - Hypothetical $50,000 Investment Year 0 Year 1 Year 2 Year 3 Net Cash Flow ($50,000) $0 $0 $77,204
(1). (1) Reliance Technologies, LLC and its affiliates do not provide any assurance of returns. Returns presented are net of all fees. Please carefully review the Fees and Disclaimers sections below for additional information concerning Sponsor's use or projected returns and fees paid to Sponsor and Reliance Technologies, LLC. -
Fees
Certain fees and compensation will be paid over the life of the ownership of the Project; please refer to the Offering Documentation for specific details. The following fees and compensation will be paid.
One-Time Fees:
Type of Fee Amount of Fee Received By Paid From Developer Fee 3.9% of all development costs Manager or its designated affiliate Capitalization Equity Financing Fee 2.5% of aggregate capital contributions Manager or its designated affiliate Capitalization Debt Financing Fee 1.0% of the Loan Amount Manager or its designated affiliate Capitalization Recurring Fees: Type of Fee Amount of Fee Received By Paid From Asset Management Fee 1.5% of aggregate capital contributions, paid monthly Manager Cash Flow Property Management Fee 3.0% of gross operating income, paid monthly StarPoint Property Management, LLC, or a designated affiliate of Manager Cash Flow RP Technologies, LLC Fees, to be paid by the Manager: Received By Technology Solution Licensing Fee Flat one-time licensing fees of $15,000 plus $1,500 per each prospective investor onboarded by Sponsor through its license and use of EP Technologies' Technology Solution RP Technologies, LLC Administration Solution Licensing Fee Flat quarterly licensing fee of $125 per investor serviced by Sponsor through the license and use of RP Technologies’ Administration Solution RP Technologies, LLC
(3). Fees may be deferred to reduce impact to investor distributions.
(4).Please see the Fees and Disclaimers sections below for additional information concerning fees paid to RP Technologies, LLC.
(1). The Sponsor's equity contribution may consist of friends and family equity and equity from funds controlled by the Sponsor.
Management

StarPoint Properties
StarPoint Properties is a real estate investment and operating company with a 25-year+ track record. Founded in 1995 and headquartered in Beverly Hills, StarPoint aims to outperform other alternative investment vehicles by leveraging its seasoned management team, proprietary underwriting systems, decades of developed infrastructure, and deep acquisition network. With a focus on the acquisition, development, and redevelopment of under-valued multifamily and commercial properties, StarPoint has delivered a weighted average IRR of 24.6% to investors since inception.
-
StarPoint Properties Track Record
Property Name City,State Asset Type Acq Date Units or SF Sq. Ft. Purchase Price Sale Price/Est. Value 62 Historical Dispositions Various Various $250,018,007 $439,698,953 Longridge Studio City,CA Multifamily 1995 29 25,088 $1,394,500 $14,500,000 Colfax North Hollywood, CA Multifamily 1997 108 90,400 $4,700,000 $58,955,750 PandO Fresno, CA Office 2004 102,580 $21,250,000 $28,000,000 Roxbury Beverly Hills, CA Office 2005 19 102,266 $43,450,000 $154,500,000 Peachtree Norcross, GA Retail 2007 24 88,835 $14,000,000 $18,000,000 Rosemead Pasadena, CA Multifamily / Retail 2007 47 29,425 $1,400,000 $12,800,000 Washington Pasadena, CA Multifamily 2007 61 52,600 $11,465,000 $24,500,000 William Cannon Austin, TX Retail 2007 31 144,657 $17,200,000 $23,000,000 Grismer Burbank, CA Multifamily 2008 54 45,285 $11,525,000 $22,500,000 Shaw Fresno, CA Office 2012 61 152,419 $13,100,000 $15,160,000 Indian Hill Claremont, CA Multifamily 2014 75 66,627 $15,750,000 $23,800,000 3rd Street Promenade Santa Monica, CA Retail 2017 2 30,660 $30,300,000 $31,370,000 Camden Beverly Hills, CA Office 2018 41 200,264 $193,000,000 $255,000,000 Telegraph Santa Fe Springs, CA Retail / Industrial 2018 16 53,975 $12,300,000 $12,300,000 Aviation Hawthorne, CA Office 2019 49,632 $13,400,000 $14,900,000 Legacy Plano, TX Multifamily 2019 346 346,000 $32,000,000 $100,000,000 Ocean Santa Monica, CA Ground Lease 2019 34,200 $65,000,000 $65,000,000 6th Street San Bernardino, CA Land (OZ Industrial Development) 2020 427,895 $6,500,000 $6,500,000 (1) The above biography and track record were provided by the Sponsor and have not been independently verified by RP Technologies, LLC or its affiliates. . Past performance is not indicative of future results. Please carefully review the Disclaimers section below.
(2) Refer to the documents section for a Performance Graph
Disclaimers
Sponsor's Projects and Targets
*Assumptions and projections included in the information on this Page, including pro forma projections (collectively “Projections”) were provided by the Sponsor or an affiliate thereof and are not reflective of the position or opinions of, nor are they endorsed by, Reliance Technologies, LLC or its affiliates, or any other person or entity other than the Sponsor or its affiliates. Reliance Technologies, LLC and its affiliates
do not provide any assurance of returns or the accuracy or reasonableness of the Projections provided by the Sponsor or its affiliates. There can be no assurance that the Sponsor’s methodology used for calculating any Projections, including Target IRR, Target Annualized Cash-on-Cash Return, and Target Equity Multiple (“Targets”), are appropriate or adequate. The Sponsor’s Projections and Targets are hypothetical, are not based on actual investment results, and are presented solely for the purpose of providing insight into the Sponsor’s investment objectives, detailing its anticipated risk and reward characteristics and for establishing a benchmark for future evaluation of the Sponsor’s performance. The Sponsor’s Projections and Targets are not a predictor, projection or guarantee of future performance. There can be no assurance that the Sponsor's Projections or Targets will be met or that the Sponsor will be successful in meeting these Projections and Targets. Projections and Target returns should not be used as a primary basis for an investor’s decision to invest.
No Approval, Opinion or Representation, or Warranty by Reliance Technologies, LLC or it Affiliates
The information on this Page, including the Sponsor's offering documentation, which may include without limitation the Private Placement Memorandum, Operating or Limited Partnership Agreement, Subscription Agreement, the Project Summary and all exhibits and other documents attached thereto or referenced therein (collectively, the “Investment Documents”) was provided by the Sponsor or an affiliate thereof.
Reliance Technologies, LLC makes no representations or warranties as to the accuracy of such information and accepts no liability therefor. No part of the information on this Page is intended to be binding on Reliance Technologies, LLC or its affiliates, or to supersede any of the Sponsor's Investment Documents.
The opinions expressed on this page are solely the opinions of the Sponsor and its affiliates and none of the opinions expressed on this Page are the opinions of, nor are they endorsed by, Reliance Technologies, LLC or its affiliates.
Sponsor's Information Qualified by Investment Documents
The Information on this Page, including of the principal terms of the Sponsor's offering, is qualified in its entirety by reference to the more complete information about the offering contained in the Sponsor's Investment Documents. The information on this Page is not complete, and each prospective investor should carefully read all of the Investment Documents and any supplements thereto, copies of which are available by clicking the links above or upon request, before deciding whether to make an investment. The information on this page should not be used as a primary basis for an investor's decision to invest. In the event of an inconsistency between the information on this Page and the Investment Documents, investors should rely on the information contained in the Investment Documents. The information on this Page and the information in the Investment Documents are subject to last minute changes up to the closing date at the sole discretion of the Sponsor and its affiliates.
Risk of Investment
This real estate investment is speculative and involves substantial risk. There can be no assurances that all or any of the assumptions will be true or that actual performance will bear any relation to the hypothetical illustrations herein, and no guarantee or representation is made that investment objectives of the Sponsor will be achieved. In the event that actual performance is below the Sponsor's Targets, your investment could be materially and adversely affected, and there can be no assurance that investors will not suffer significant losses. A loss of part or all of the principal value of your investment may occur. You should not invest unless you can readily bear the consequences of such loss. Please see the Sponsor's Investment Documents for additional information, including the Sponsor's discussion concerning risk factors
Risk of Forward-Looking Statements
Forward-looking statements are found here and in the applicable Investment Documents and may include words like “expects,” “intends,” “anticipates,” “estimates” and other similar words. These statements are intended to convey the Project Sponsor's projections or expectations as of the date made. These statements are inherently subject to a variety of risks and uncertainties. Please see the applicable Investment Documents for disclosure relating to forward-looking statements. All forward-looking statements attributable to the Sponsor or its affiliates apply only as of the date of the offering and are expressly qualified in their entirety by the cautionary statements included elsewhere in the Investment Documents. Any financial projections are preliminary and subject to change; the Sponsor undertakes no obligation to update or revise these forward-looking statements to reflect events or circumstances that arise after the date made or to reflect the occurrence of unanticipated events. Inevitably, some assumptions will not materialize, and unanticipated events and circumstances may affect the ultimate financial results. Projections are inherently subject to substantial and numerous uncertainties and to a wide variety of significant business, economic and competitive risks, and the assumptions underlying the projections may be inaccurate in any material respect. Therefore, the actual results achieved may vary significantly from the forecasts, and the variations may be material.
Sponsor's use of Debt
A substantial portion of the total acquisition for the Property will be paid with borrowed funds, i.e., debt. There can be no assurance that the Sponsor will secure debt on the rates and terms noted above, or at all. All of the Sponsor's estimated rates and terms of the debt financing are subject to lender approval, including but not limited to the annual interest rate and possible increases in capital reserve requirements for funds to be held in a lender-controlled capital reserve account. The use of borrowed money to acquire real estate is referred to as leveraging. Leveraging increases the risk of loss. If the Sponsor were unable to pay the payments on the borrowed funds (called a "default"), the lender might foreclose, and the Sponsor could lose its investment in its property.
In addition, unless the debt provides for a fixed rate of interest during the term of the loan and/or any subsequent extensions, the total amount of interest paid over the term of the debt will increase by the same amount as the related index. For example, if the index rate increases by 0.50% (50 basis points) the interest rate on the loan will increase by the same amount. The amount of such interest rate increases may be capped either by its terms or as the result of the Sponsor entering into an arrangement that caps the interest rate with respect to the debt at a particular rate.
Sponsor's Offering is Not Registered
The interests offered by the Sponsor will not be registered under the Securities Act of 1933, as amended (the “Securities Act”) in reliance upon the exemptions from registration pursuant to Rule 506(c) of Regulation D as promulgated under the Securities Act (“Private Placement.”). In addition, the interests will not be registered under any state securities laws in reliance on exemptions from registration. Such interests are subject to restrictions on transferability and resale and may not be transferred or resold except as permitted under applicable state and federal securities laws pursuant to registration or an available exemption. All Private Placements on the RelianceProperties Platform are intended solely for “Accredited Investors,” as that term is defined Rule 501(a) of the Securities Act. Prospective investors must certify that they are Accredited Investors and provide either certain supporting documents or third party verification, and must acknowledge that they have received and read all investment materials.
Reliance Technologies, LLC Fees and Conflicts
Reliance Technologies, LLC, an affiliate of RelianceProperties, operates the RelianceProperties Platform. Reliance Technologies, LLC charges a fixed, non-percentage-based licensing fee for real estate companies and their sponsors to license and use the Reliance Technologies LLC's proprietary Platform, including one-time flat licensing fees for its Technology Solution and an ongoing quarterly flat licensing fees for its Administration Solution. An estimate of the Technology Solution licensing fee is included in the Closing Costs above and is intended to be capitalized into the transaction at the discretion of the Sponsor. The licensing fees received by Reliance Technologies, LLC are disclosed in the relevant operating agreement(s). Additionally, from time to time, employees of Reliance Technologies, LL C and its affiliates invest in Sponsor's offering. Reliance Technologies LLC's receipt of licensing fees and its employee's investments in Sponsor's offering creates a conflict of interest between EquinoxProperties and its affiliates, and investors or prospective investors.
No Investment Advice
RelianceProperties and Reliance Technologies, LLC are not a registered broker-dealer, investment adviser or crowdfunding portal. Nothing on this Page should not be regarded as investment advice, either on behalf of a particular security or regarding an overall investment strategy, a recommendation, an offer to sell, or a solicitation of or an offer to buy any security. Advice from a securities professional is strongly advised,
and we recommend that you consult with a financial advisor, attorney, accountant, and any other professional that can help you to understand and assess the risks associated with any real estate investment.
For additional information on risks and disclosures visit https://www.reliancepropertiesrealtor.com/investment-disclosure.php.